
up:: For Press
Charts you can reuse
Every chart here is free to republish, including commercially, and you don’t need to ask. Attribution is the only condition.
Each one comes in 4 formats: a vector PDF for print, an SVG for redrawing, a PNG at 300 dpi, and the underlying data as a CSV so you can check the numbers or rebuild the figure yourself.
The short version:
- Free to republish with attribution, in any outlet, commercial or not.
- The credit line is
Chart: LaMarr Labs Post-Quantum Field Guide. The primary source is already printed on every image. - Built at one newspaper column, so the type is legible at roughly 4 inches wide without rescaling.
- The CSV beside each chart carries the qualifiers that wouldn’t fit on the image, including what the figure does not establish.
- Redraw, restyle, crop, or translate them. The one thing to avoid is changing the numbers while keeping the source line.
What exactly am I allowed to do with these?
Republish them, in print or online, in a commercial outlet or a non-commercial one. Redraw them in your own house style. Translate the labels. Crop them. Pull the CSV and build something different from the same numbers.
The condition is attribution: Chart: LaMarr Labs Post-Quantum Field Guide. If your format allows a link, the one to use is https://fieldguide.lamarrlabs.com.
Every source named in a caption below is indexed with a direct link to the original document at The primary documents behind every claim, and every figure with the wording that states it accurately at Every figure and where it comes from.
Each image already carries its own primary source, printed small at the bottom. That line matters more than the credit to this Guide, because it points at the original document rather than at an intermediary, so please keep it when you can.
The one request: if you change a number, redraw the figure and remove the source line. A source line should always match the data printed beside it.
If you need a variant that doesn’t exist, a different crop, a specific figure isolated, or the same data at a different aspect ratio, email addie@lamarrlabs.com and you’ll get it.
Which chart do I want?
| If you’re writing about | Use |
|---|---|
| How close the machine is | The falling estimate · What 26 experts expect |
| What actually breaks | What breaks and what survives · Where a connection breaks |
| Why it’s urgent now | The 2 clocks · Data lifetime against migration |
| Government deadlines | The national deadlines |
| What’s already shipped | The deployment timeline |
| Personal data and DNA | The 23andMe amplification · The familial reach |
| Money and cost | Bitcoin’s exposed keys · The Y2K comparison |
The charts
How close is the machine?
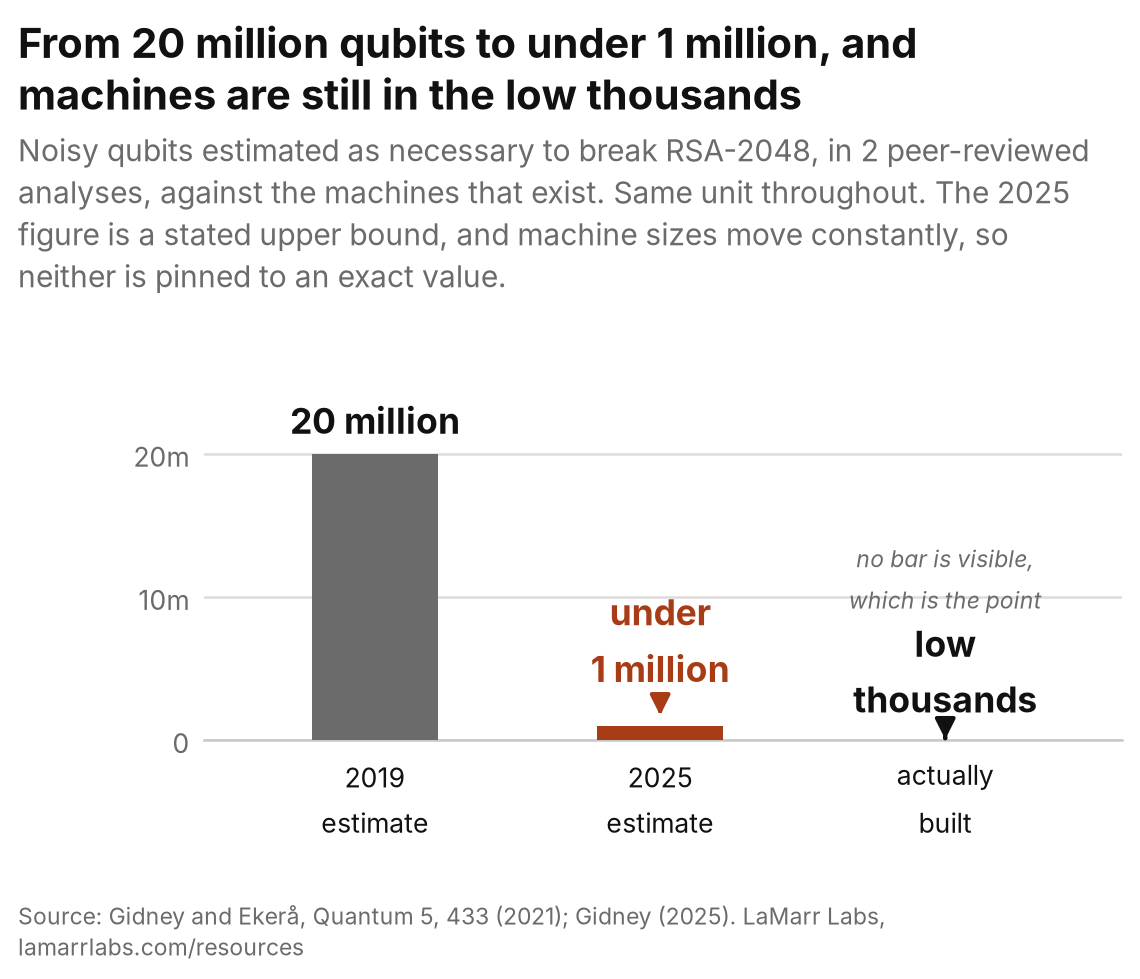
Source: Gidney and Ekerå, Quantum 5, 433 (2021); Gidney (2025), for the 2 estimates. The third bar, the machines actually built, has no cited primary, because neither paper says anything about machines that exist. The CSV records that gap.
PDF · SVG · PNG · Data
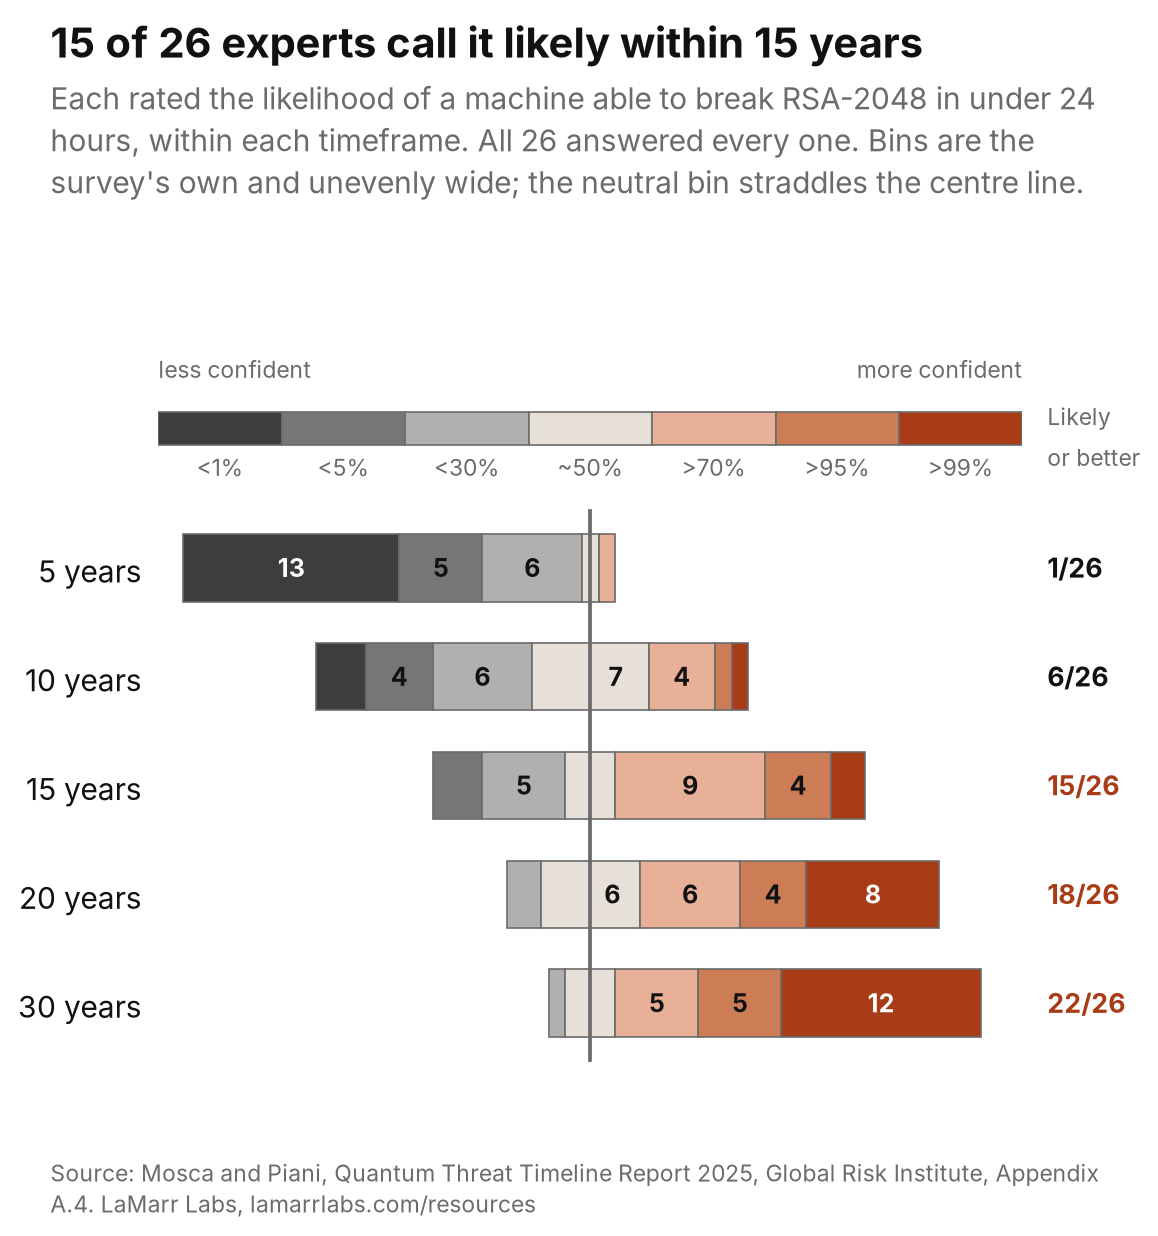
Source: Mosca and Piani, Quantum Threat Timeline Report 2025, Global Risk Institute / evolutionQ, Appendix A.4. PDF · SVG · PNG · Data
What actually breaks?
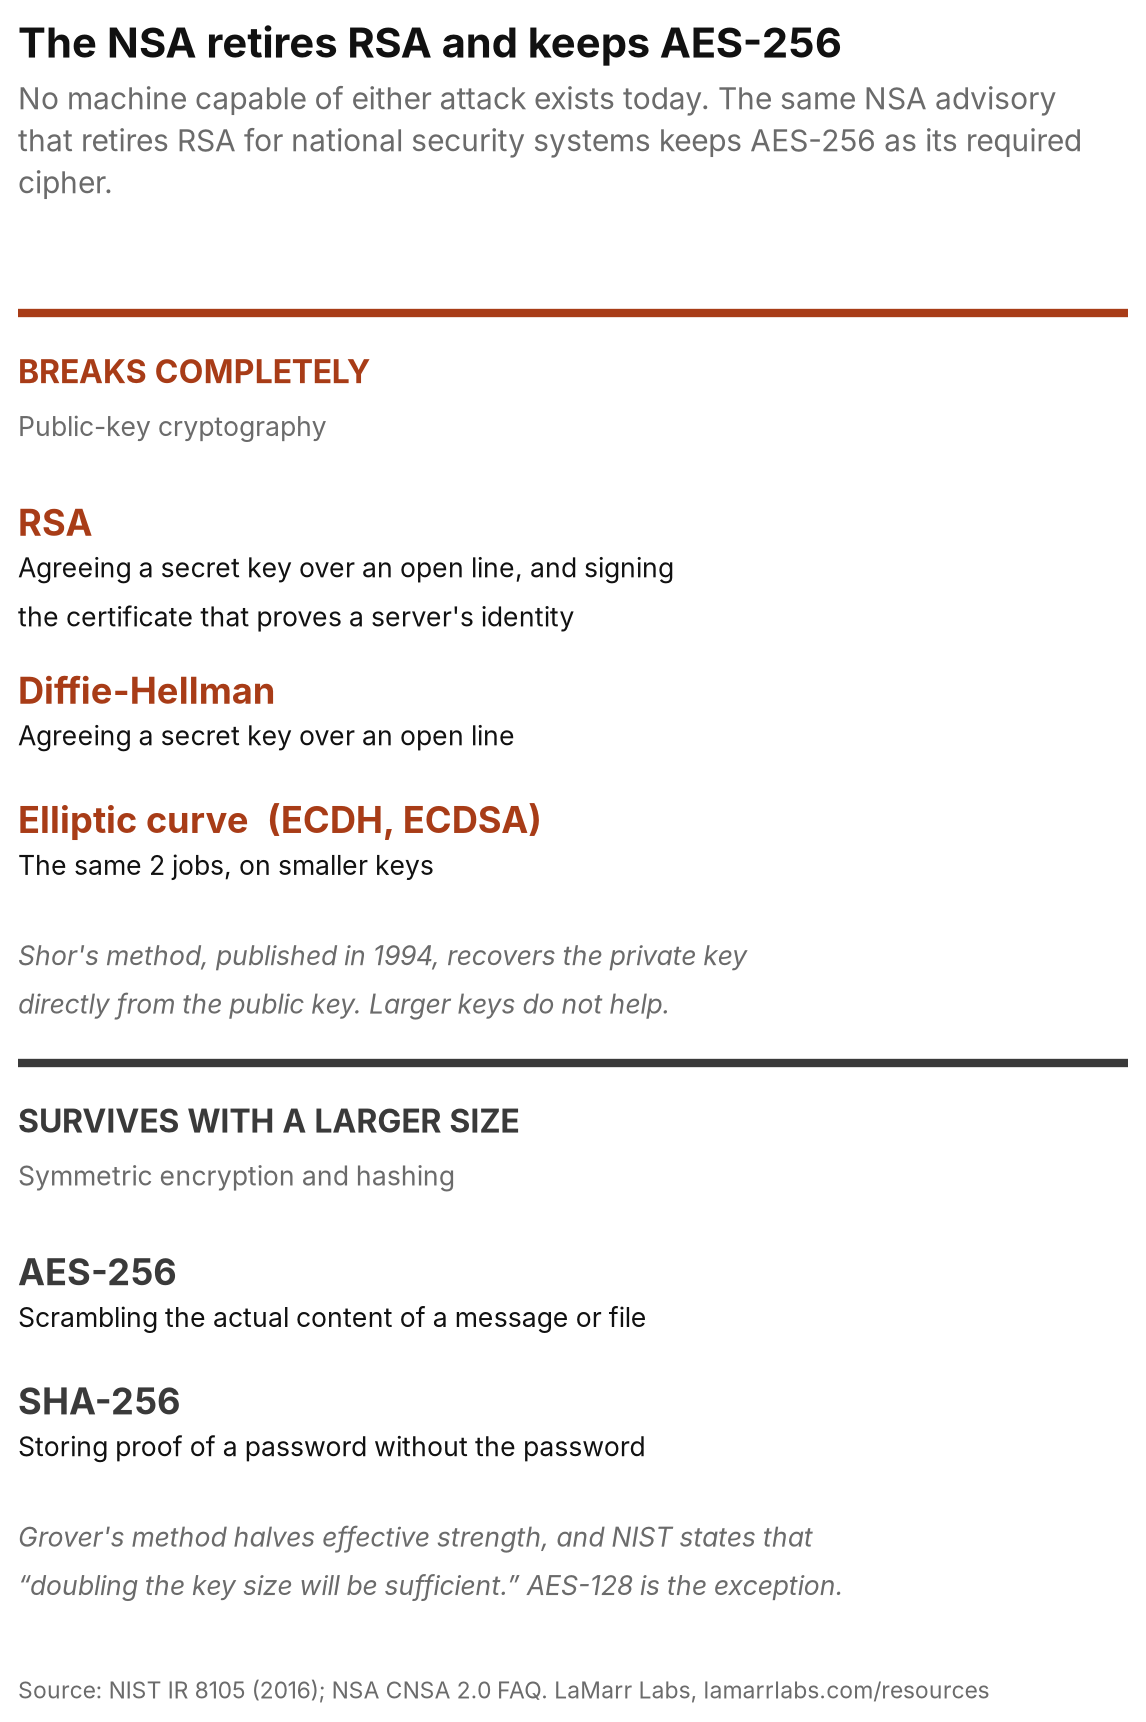
Source: NIST IR 8105 (2016), which names the families rather than the parameter sets and hedges its own advice, “this recommendation does not take into account the possibility of more sophisticated quantum attacks”; NSA CNSA 2.0 FAQ, which sets the parameters.
PDF · SVG · PNG · Data
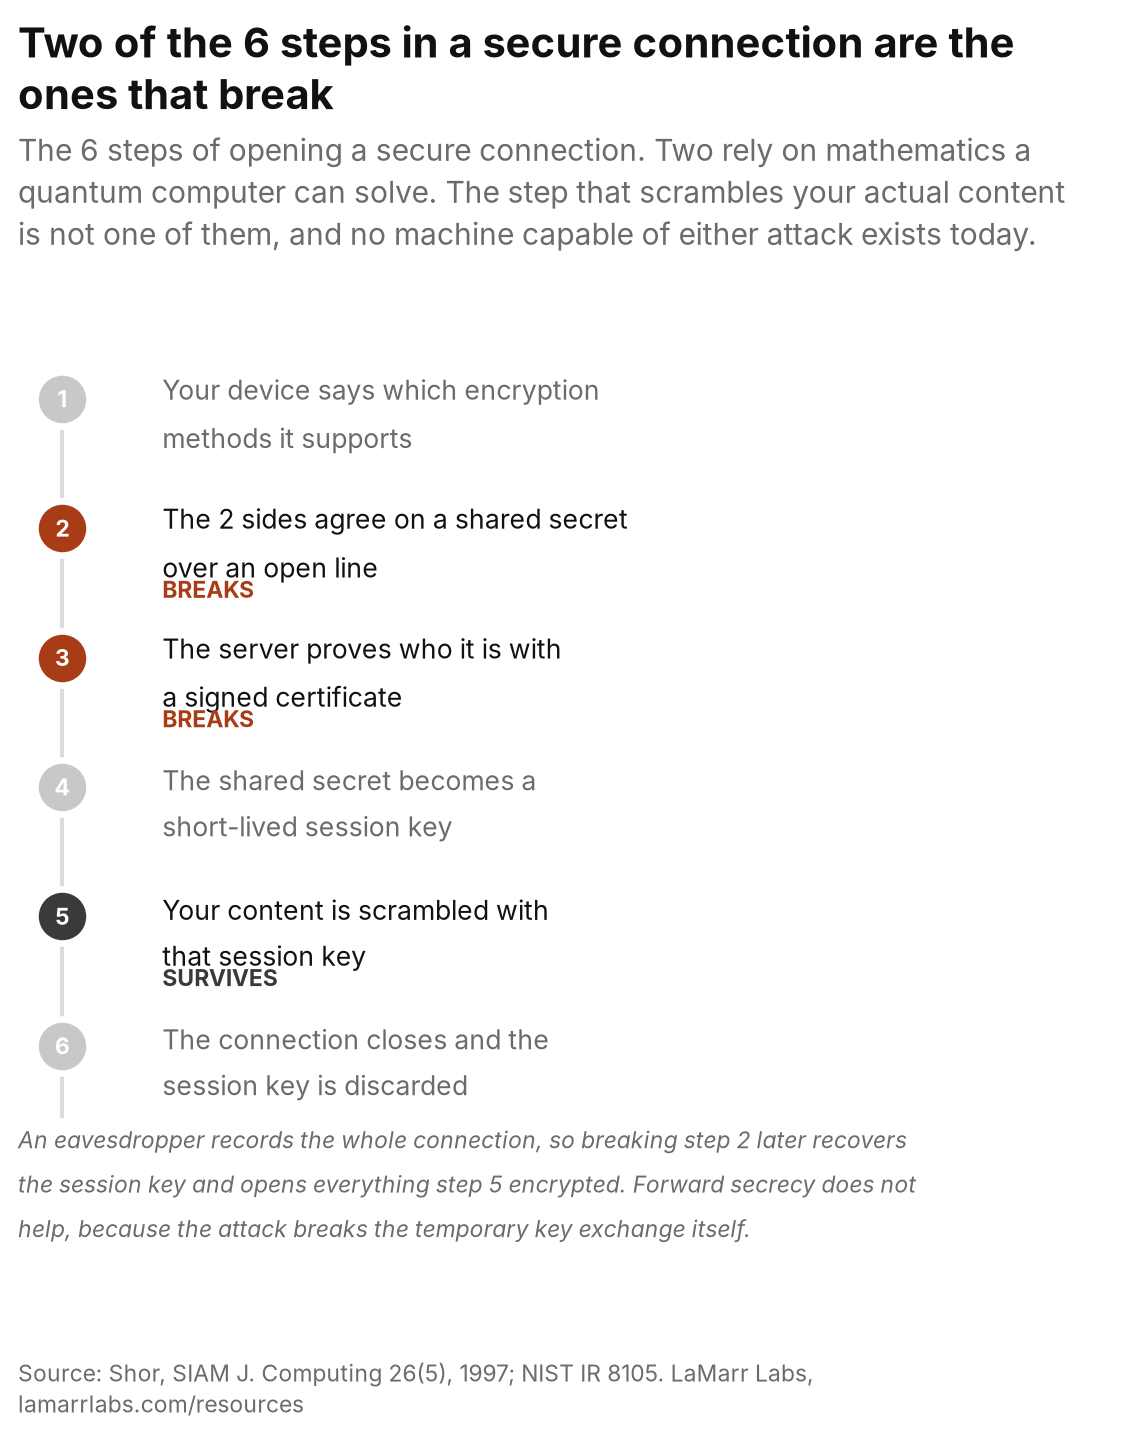
Source: Shor, SIAM J. Computing 26(5), 1997; NIST IR 8105. PDF · SVG · PNG · Data
Why is it urgent now?
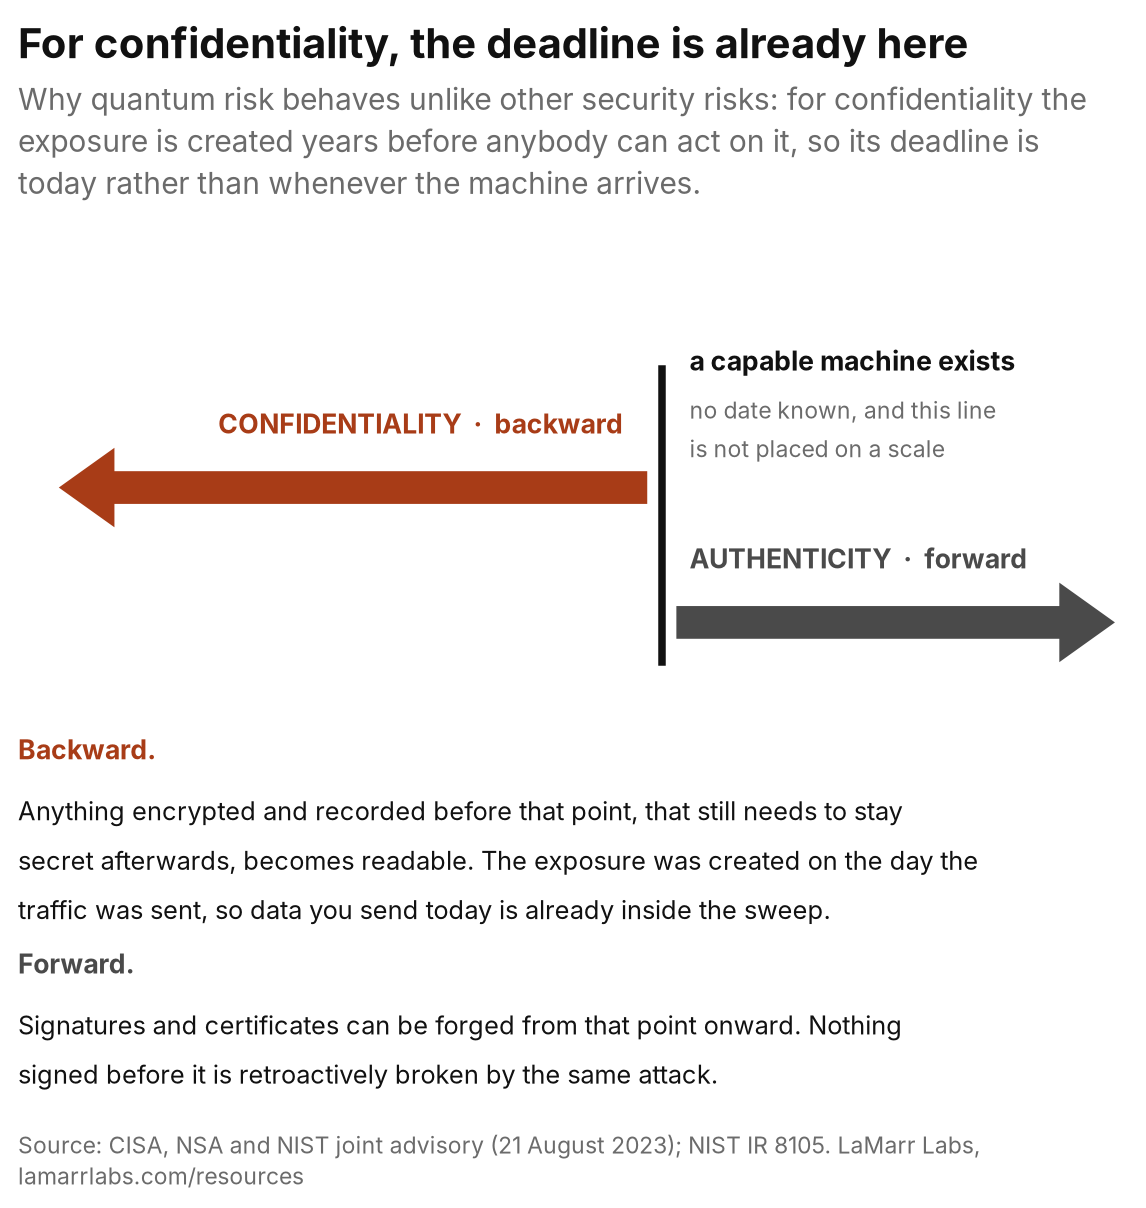
Source: CISA, NSA and NIST joint advisory (21 August 2023); NIST IR 8105.
PDF · SVG · PNG · Data
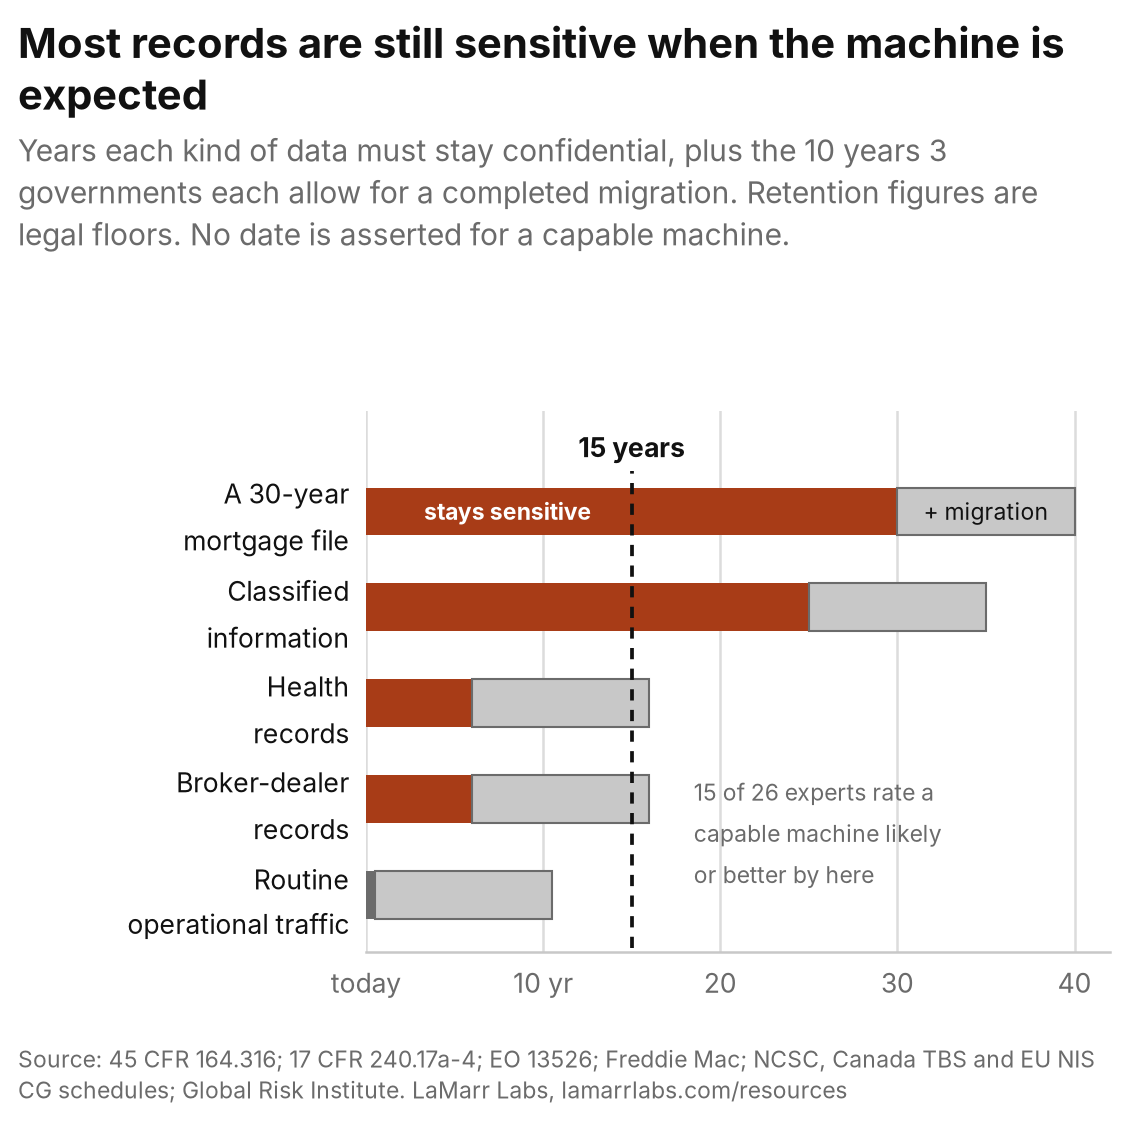
Source: 45 CFR 164.316; 17 CFR 240.17a-4; EO 13526; Freddie Mac; NCSC, Canada TBS and EU NIS CG schedules; Global Risk Institute, Quantum Threat Timeline Report 2025. PDF · SVG · PNG · Data
What have governments actually set?
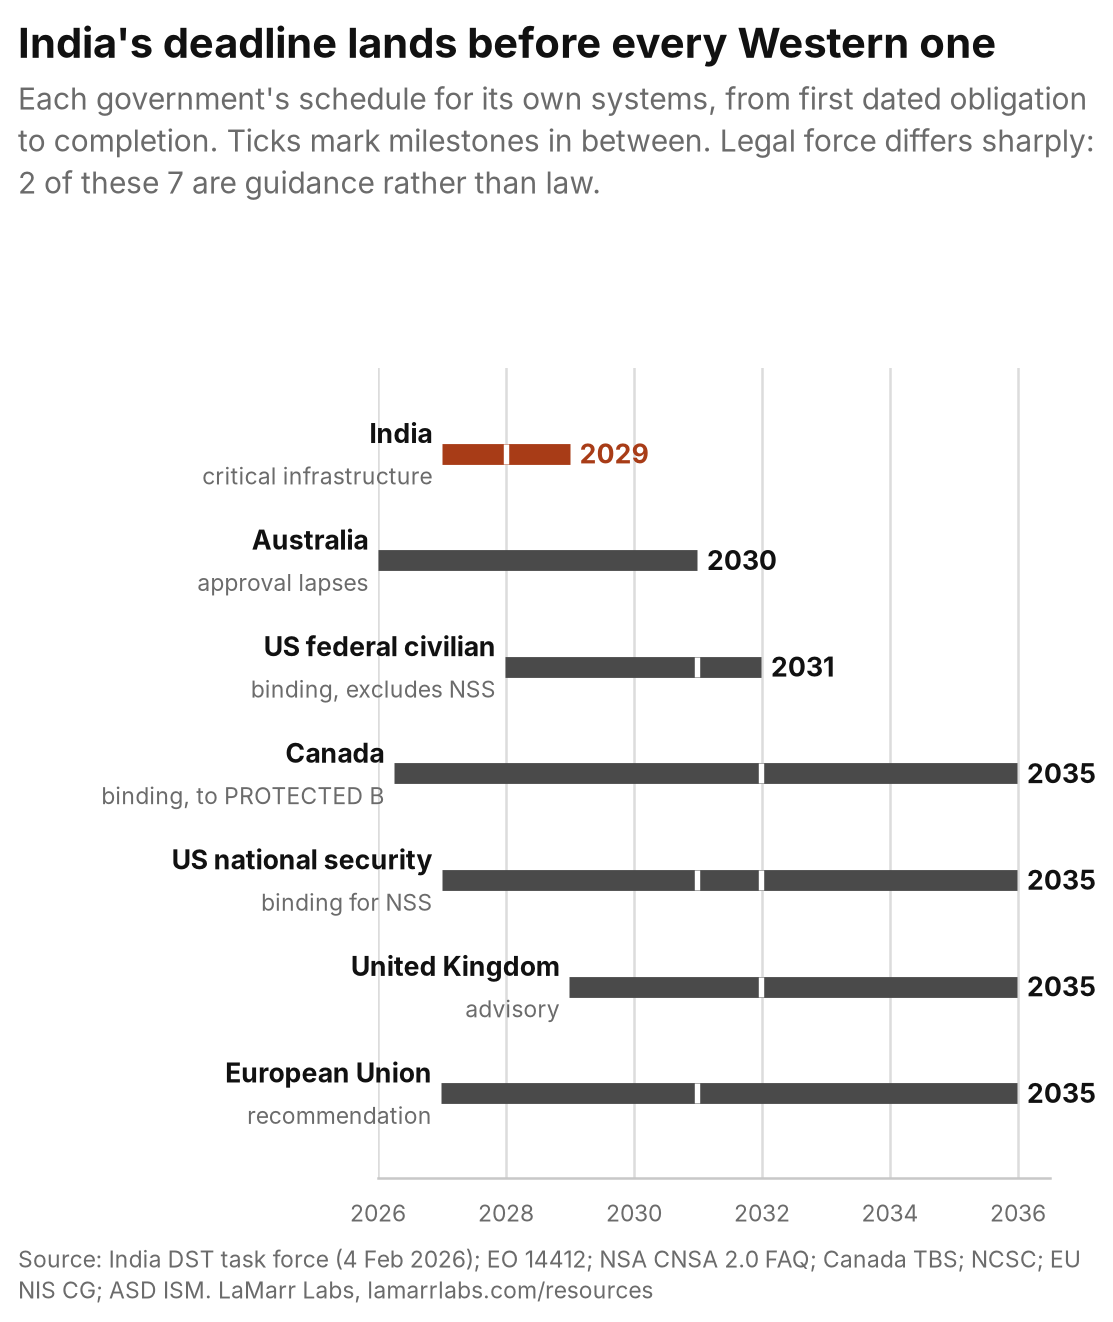
Source: India DST task force (4 Feb 2026); EO 14412; NSA CNSA 2.0 FAQ; Canada TBS; NCSC; EU NIS CG; ASD ISM.
PDF · SVG · PNG · Data
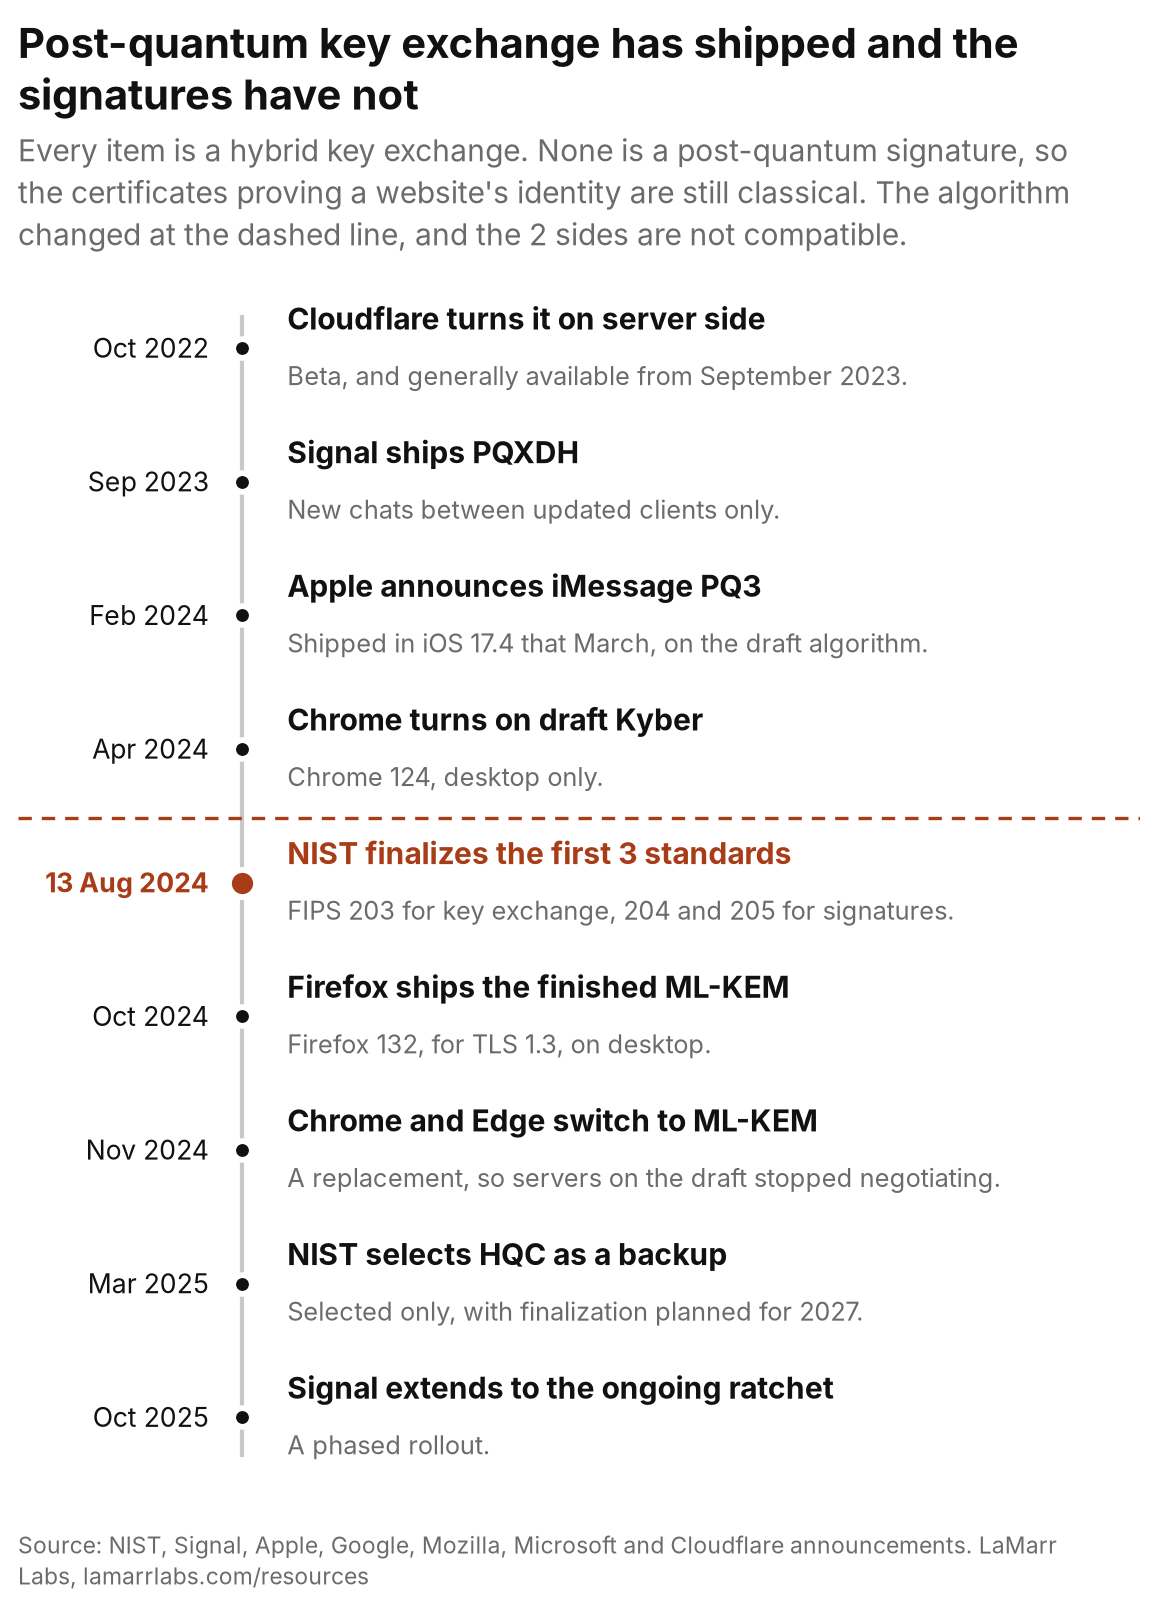
Source: NIST, Signal, Apple, Google, Mozilla, Microsoft and Cloudflare announcements; Cloudflare, “Cloudflare targets 2029 for full post-quantum security,” 7 April 2026 for the 65% figure, which is a live reading that rises month over month and is cited here with its date rather than as a durable fact; Loizou and Ghadafi, arXiv:2608.02147, a preprint, for the UK scan; RFC 10024, Standards Track, August 2026. PDF · SVG · PNG · Data
What does it mean for a person?
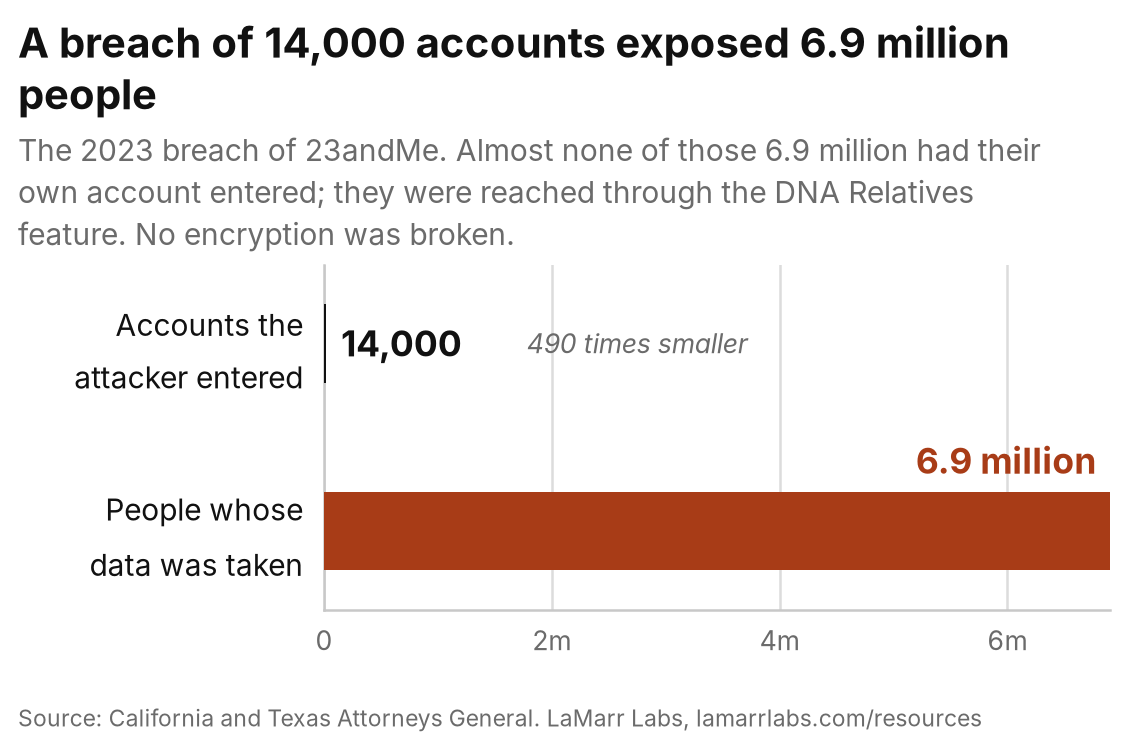
Source: California and Texas Attorneys General.
PDF · SVG · PNG · Data
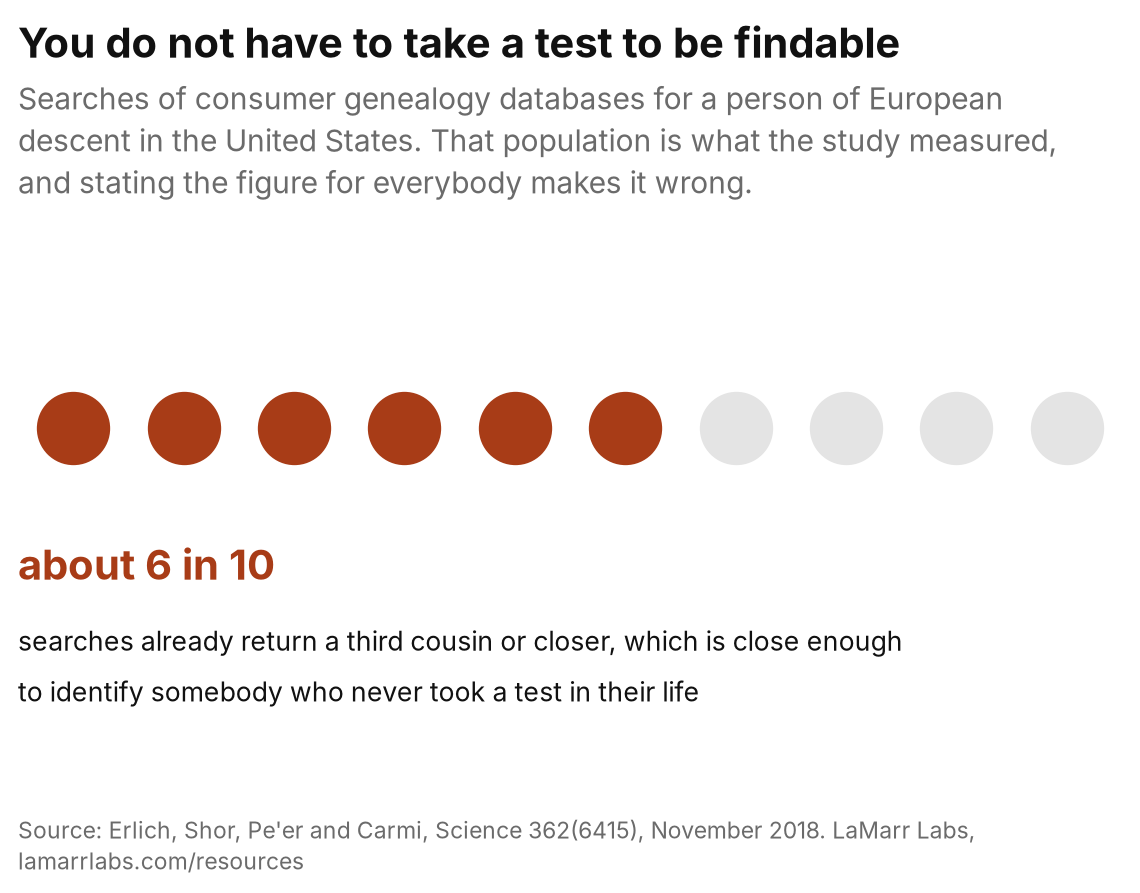
Source: Erlich, Shor, Pe’er and Carmi, Science 362(6415), November 2018. PDF · SVG · PNG · Data
What about money?
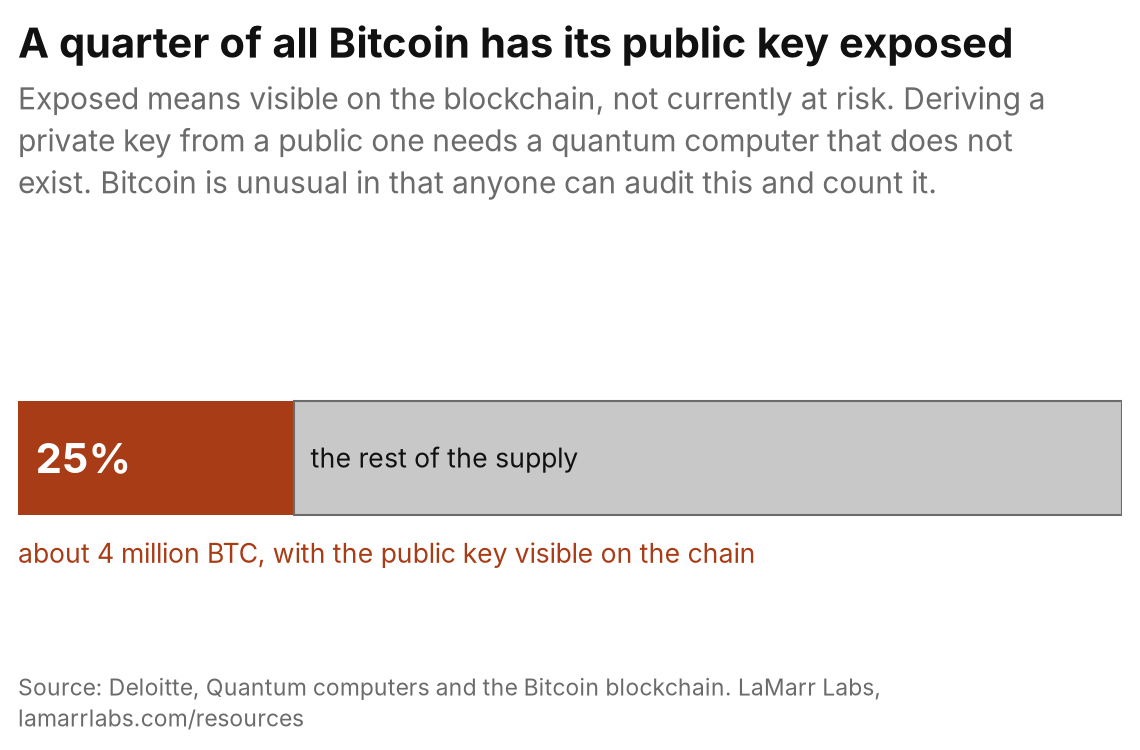
Source: Deloitte, Quantum computers and the Bitcoin blockchain.
PDF · SVG · PNG · Data
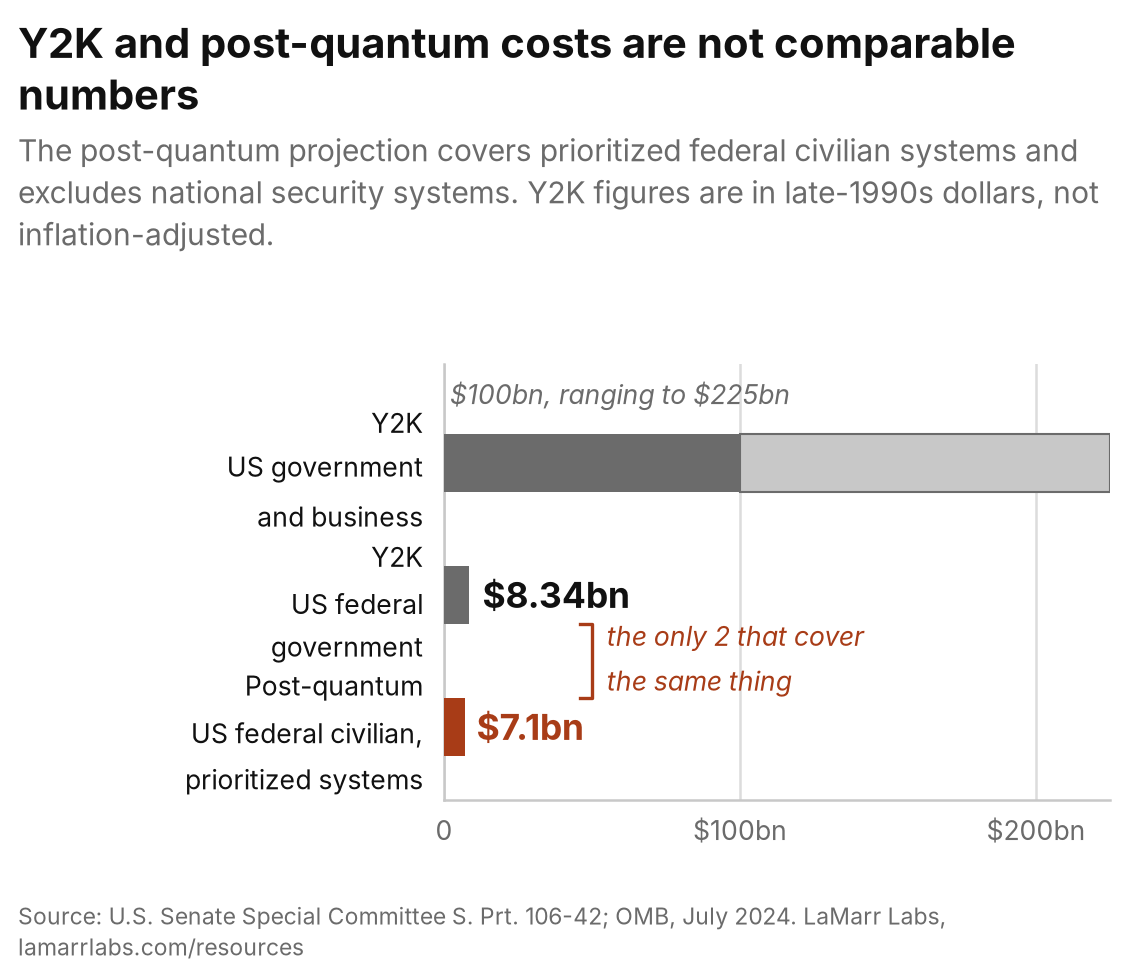
Source: U.S. Senate Special Committee S. Prt. 106-42; OMB, July 2024. PDF · SVG · PNG · Data
Questions people ask
Do I need to ask permission? No. Republish them.
Can my commercial outlet use them? Yes, commercial use included.
What exactly do I credit? Chart: LaMarr Labs Post-Quantum Field Guide, plus the primary source already printed on the image.
Can I redraw it in our house style? Yes, and the SVG and the CSV are both there for that. The attribution still applies to the redrawn version, because the sourcing work is what you’re using.
Why is there a CSV? So you can check the numbers rather than take them on trust, and so you can rebuild the figure without tracing pixels. Each one also carries the qualifiers that wouldn’t fit on the image, including what the figure does not establish.
Why are they so small? They’re designed at one newspaper column, roughly 4 inches, which is the size they’re most likely to be printed at. Designing at that size means the type is legible without rescaling. The PDF and SVG are vector, so they scale up cleanly for a full-page or on-screen use.
Can I get a figure that isn’t here? Email and ask. If it can be sourced properly it can be built.
Are these AI-generated? No. Each is drawn from a named primary document, and the data behind it is in the CSV next to it.
Where to go next
- For Press is the full press index, with 4 self-contained resources.
- Every figure and where it comes from is every number in this resource with the wording that states it accurately.
- The primary documents behind every claim is every source document in one annotated index.
- Corrections and verification is how to report an error or verify a claim before publishing.
Last verified 2026-09-17 · Maintained by Addie LaMarr, LaMarr Labs.